
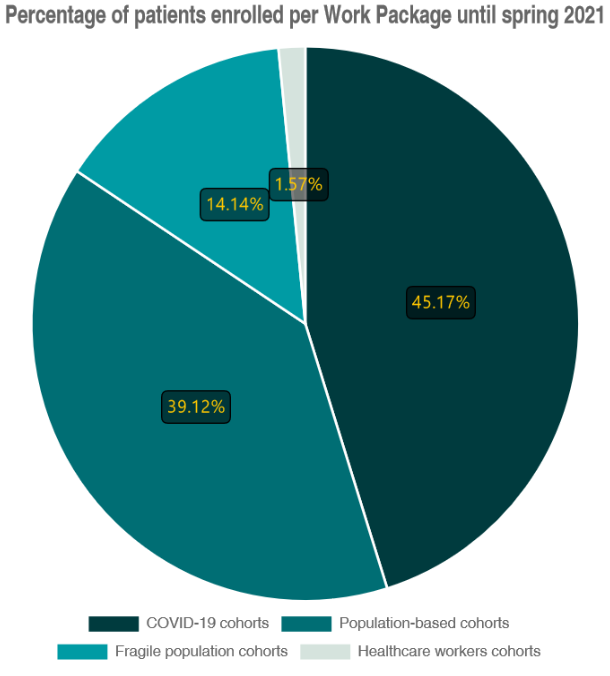
Percentage of patients enrolled per country
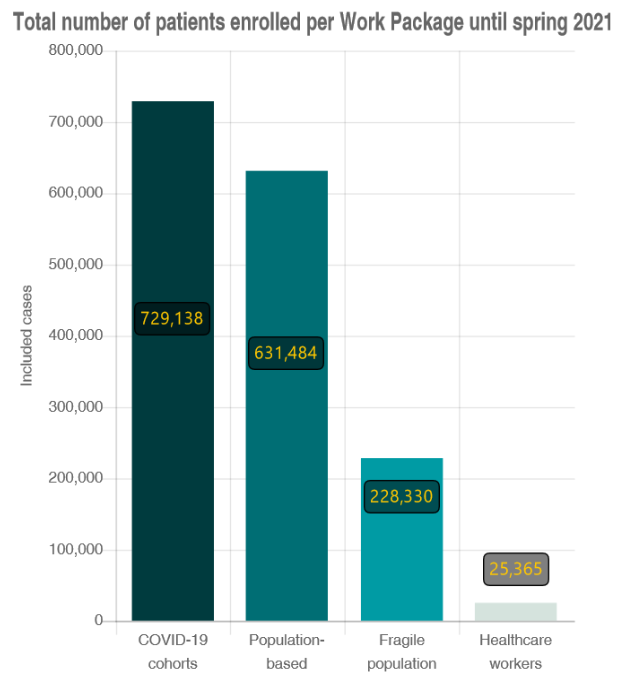
Please go over the different pie elements to see the total number of included cases
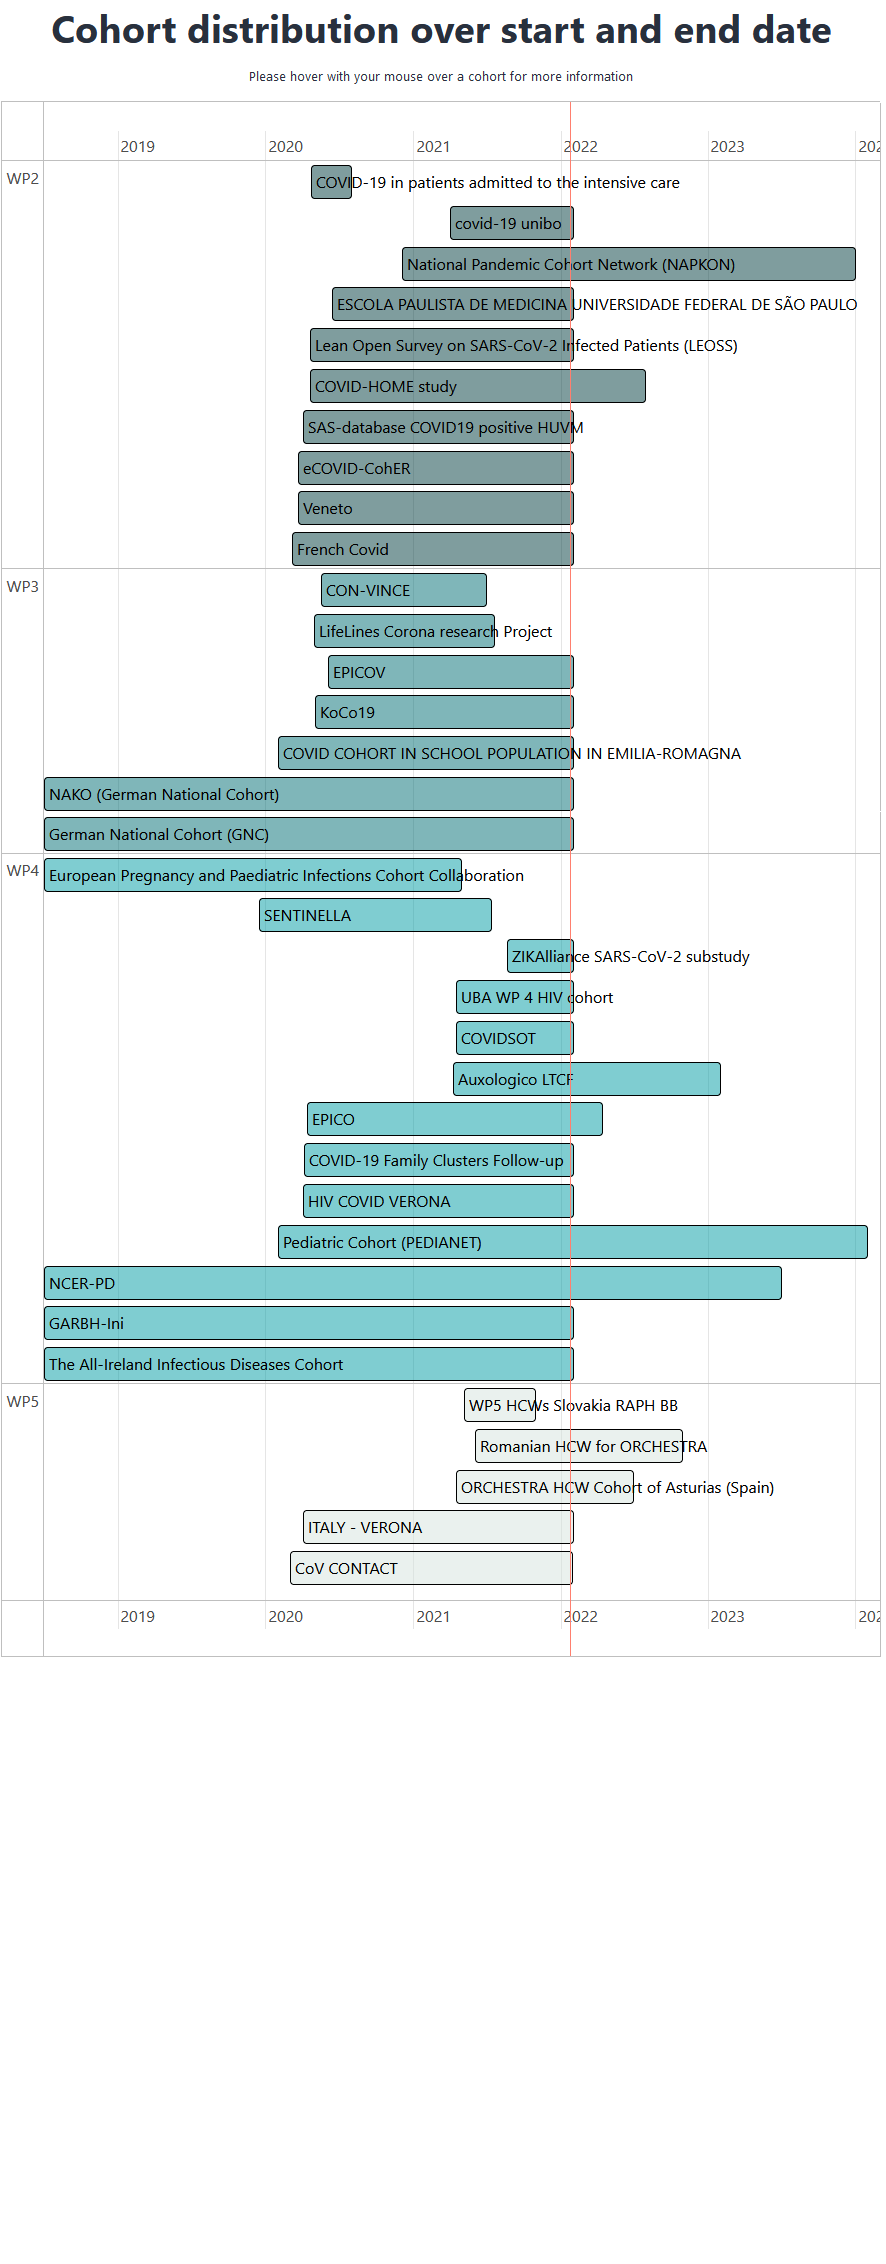
Cohort distribution over start and end date
Please hover with your mouse over a cohort for more information
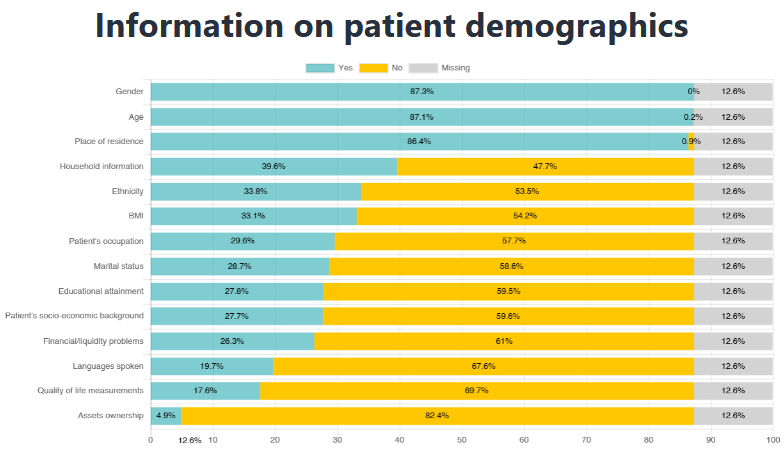
Information on kind of patients